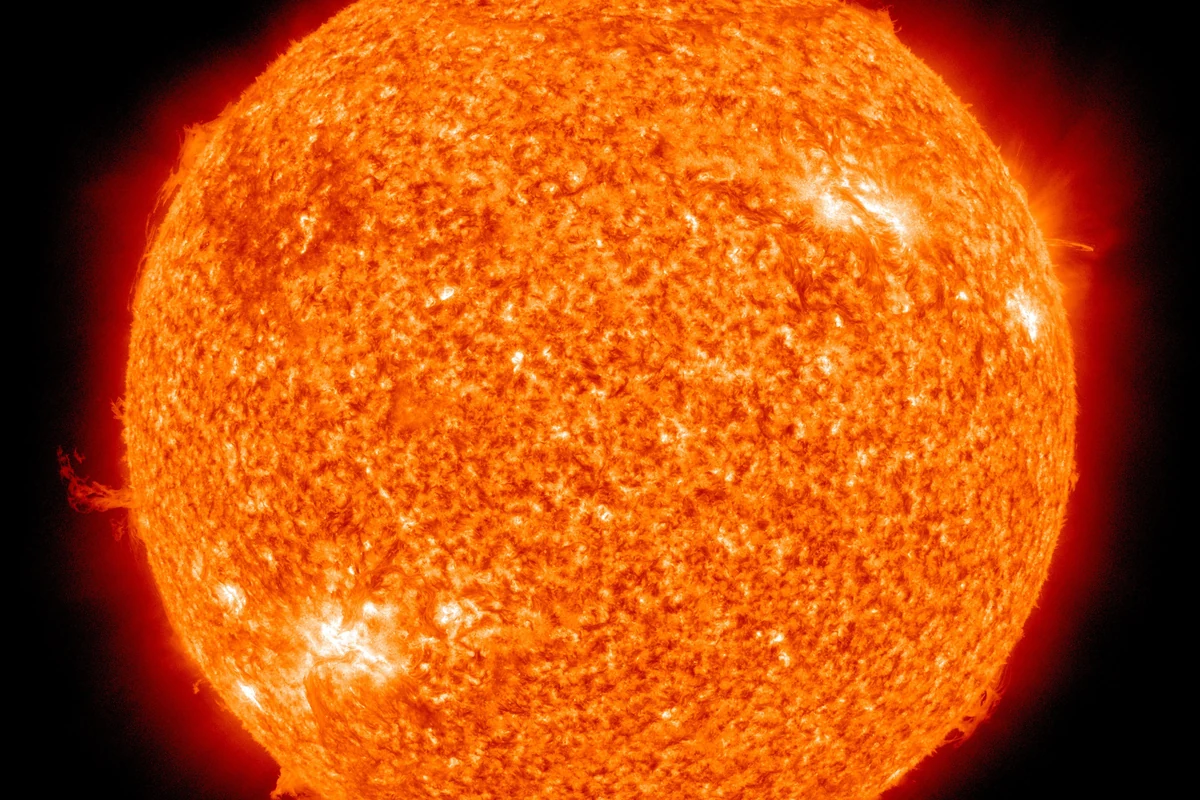
A solar flare is the most violent energy release in the solar atmosphere. Within a few minutes, particles are accelerated and radiation surges from hard X-rays to microwaves, while the near-Earth environment is disturbed. Yet the field that drives the whole event has kept one of its best secrets: nobody could say what the magnetic field in the lower atmosphere actually does during those minutes.
The omission was not from lack of interest. The standard approach reads polarization signatures in the solar spectrum, then inverts a radiative-transfer model to infer field strength. A flare distorts the very line profiles being measured, so the model's assumptions collapse and the inversion becomes unreliable or simply fails.
A second obstacle is brutally practical. Flares evolve fast, so exposures must be short; short exposures mean weak signal, and both signal-to-noise and precision fall apart. The interval most worth watching was precisely the interval nobody could resolve, leaving a persistent gap in solar physics.
The new work takes a different route. Instead of untangling polarization from model assumptions, the team measured the distance by which a magnetic field splits a spectral line, the Zeeman separation. A stronger field pushes the components further apart, and that spacing is a directly measurable quantity that requires no prior picture of the atmosphere.
The choice of line is the trick. Zeeman splitting grows with the square of wavelength, so moving to longer wavelengths magnifies the separation. A magnesium line near 12.32 micrometres lifted a barely visible gap into a measurable one, improving field precision from the order of a hundred gauss to better than ten gauss, a full order of magnitude.
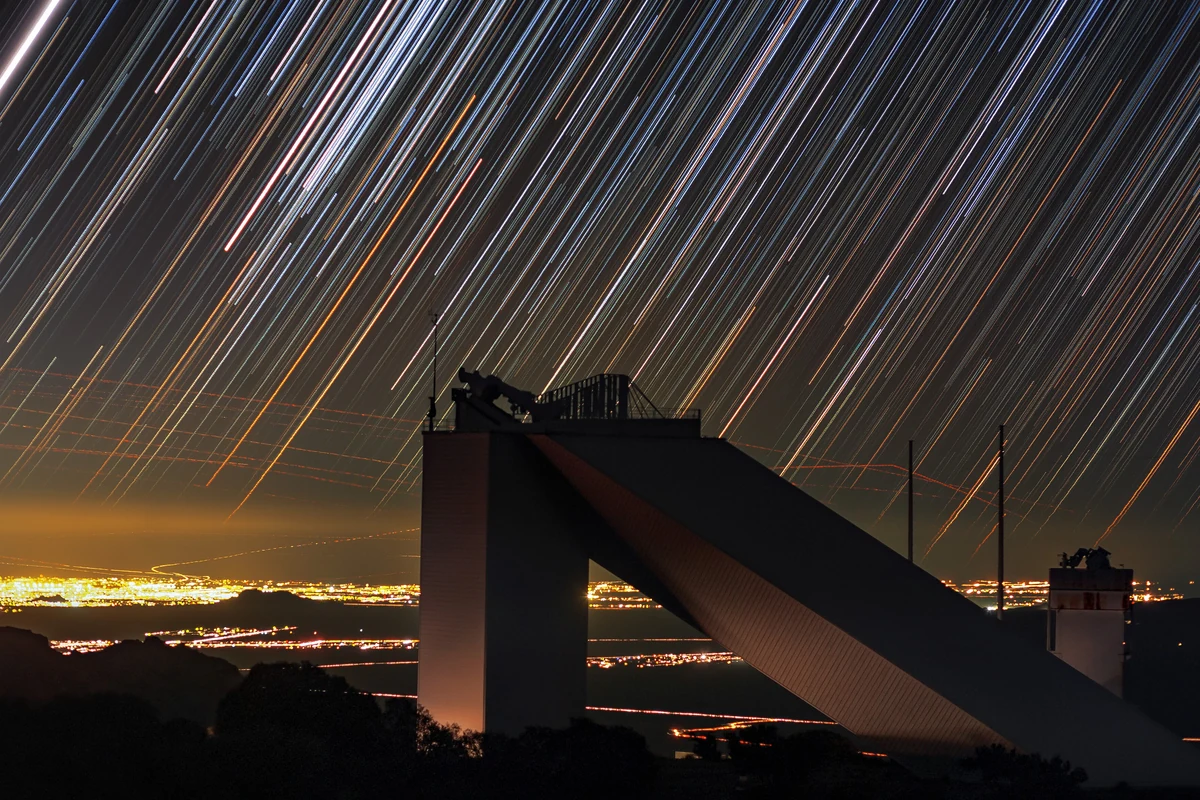
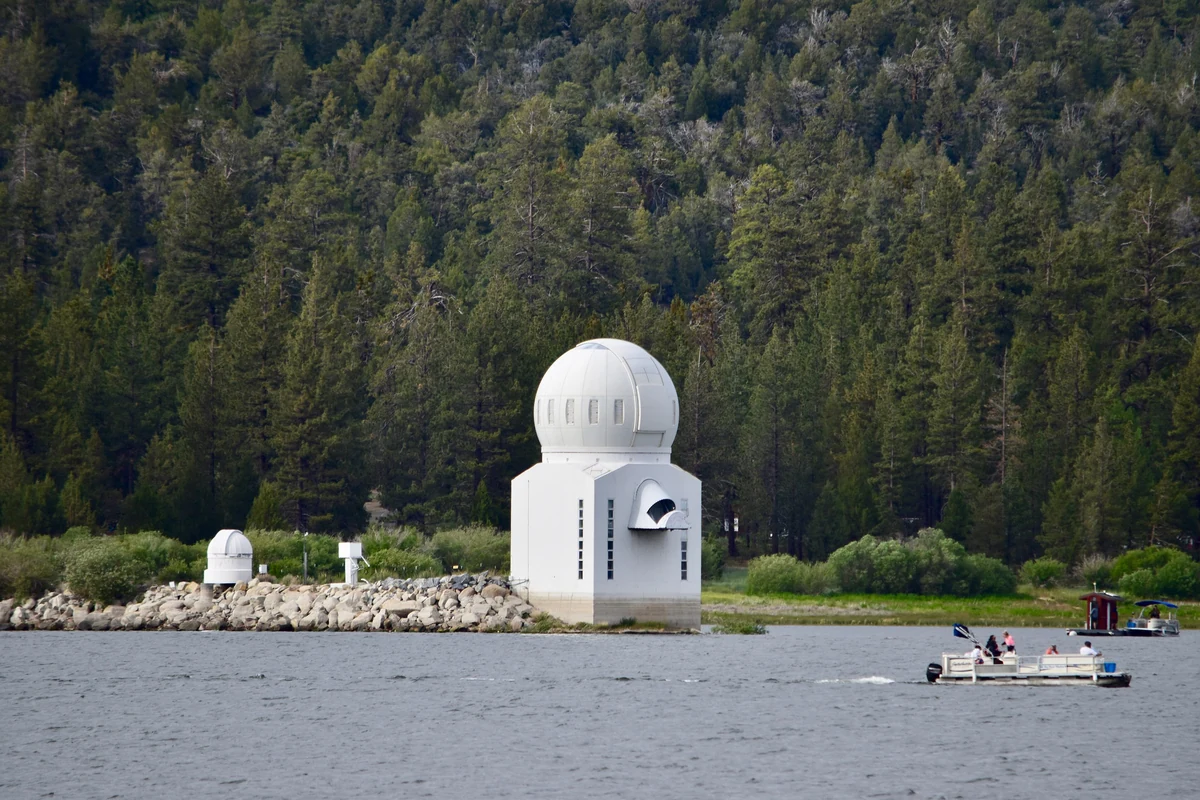
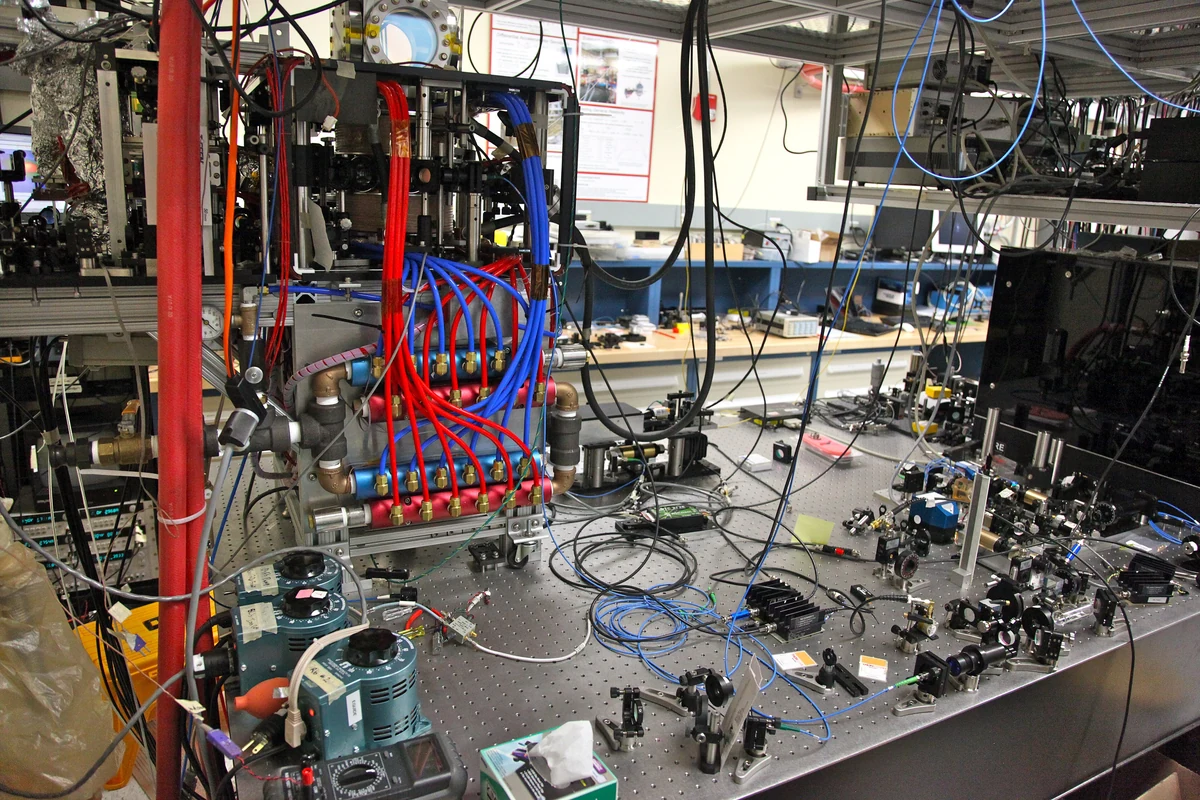
To keep both high spectral resolution and imaging, the instrument used an infrared Fourier-transform spectrograph, sited on a dry plateau roughly four kilometres above sea level to limit the water vapour that absorbs mid-infrared light. Such engineering details decide whether a few minutes of data are a discovery or just noise.
The result came from an X1.5 flare: during the impulsive phase, field strength beneath the flare ribbons dropped measurably. The team did not stop at seeing it. They simulated the spectral evolution with a flare atmospheric model, and the match between simulation and observation is what makes the claim hold.
Why does a decrease deserve a paper? Because a flare is, at bottom, the release of magnetic energy. If the field genuinely weakens at the most violent moment, that is the first direct trace of energy being withdrawn from the magnetic reservoir. The question of where the energy goes shifts from theoretical inference to something that can be tracked minute by minute.
Several long-running debates gain a new constraint from here: why the chromosphere and corona are so much hotter than the photosphere, how magnetic energy accumulates before it is released, and whether the corona and lower atmosphere feed back on one another dynamically. Arguments that previously rested on self-consistent models now have an observational boundary to satisfy.
The most tangible extension is space-weather forecasting. Strong flares disturb the ionosphere, affect shortwave communication and navigation accuracy, and add risk for equipment in orbit. The hard part has never been whether an eruption will occur, but how strong it becomes and how it evolves; a quantitative diagnosis of field evolution supplies an input that was missing.
Restraint is warranted. This is a single event on a single line, far from a statistical conclusion. The mechanism behind the weakening, whether it recurs across flare classes, and how the released energy is partitioned all need more events and independent reproduction. A reviewer called this class of observation a first, which is both praise and a reminder that the work sits at a starting point.
Perhaps the more durable lesson is methodological. When a field has been blocked by a measurement limit for decades, the answer is not always a bigger instrument; sometimes it is a different wavelength and a different observable that walks around the problem. With this mid-infrared window open, questions that were askable but unmeasurable can be queued up again.
From the field changed to how it changed, by how much, and where the energy went, there is an entire measurement capability in between. Only the first step has been taken, but a few minutes of chaos have finally been written down as a curve with tick marks.
Comments